The Iowa Environmental Mesonet (IEM) collects environmental data from cooperating members with observing networks. The data are stored and made available on this website.

IEM Daily Feature

Accounting Fun

Posted: 06 Oct 2026 05:30 AM, Views: 489
Our just finished month of September was very wet and many folks are always curious if it was record breaking or not. The answer to this question is perhaps not as straight forward as many would hope it to be. The primary reason is that the vast majority of long term climate data provides 24 hour totals valid at some reporting hour during the daylight hours and not at midnight. This creates an accounting problem for how precipitation is included within a given calendar month since the observation on the first and then the first of the next month can both include partial precipitation totals that are inside and/or outside of the current month of interest. For Iowa and a number of other states, this situation was exasperated by a very heavy rainfall event on the evening of the 30 September into 1 October. In general, this significant rainfall event did not "count" into the September totals as the 24 hour reports came on 1 October. Now for a handful of reporting sites with 24 hours reports near midnight, it did, but for things like climate district and statewide estimated totals, it did not. Oh boy! So the featured chart presents a summary of the impact of this event on September precipitation ranks for the unofficial IEM computed climate district values. The first two data columns are generally the "standard" way with the 24 hour report on 1 October not included. The second set of columns include the 1 October report, but then drop the 1 September report. The final column presents the rank change between the two. Note that the ranks are computed for the exact specified days in each case. The top five largest positive and negative rank changes are shown along with the Iowa values. So two Iowa districts are shown as being second wettest, but wettest if that last big rainfall event was included.
Rate Feature

Previous Years' Features
Cascade, IA Webcam:
News Items  

7 Oct Partial Outage
Posted: 1:26 PM

5 Sep NWS Data Outage
Posted: 5 Sep 2:03 PM

4 Sep ISU Network Issue [resolved]
Posted: 4 Sep 11:03 AM

12 Aug Service Degradation [resolved]
Posted: 12 Aug 6:13 AM

MRMS Archive Downsizing
Posted: 9 Aug 4:15 PM

Sign up for the Daily Bulletin

Current Website Performance:
Bandwidth: 92.4 MB/s
Total Website: 4,600 req/s
API/Data Services: 279.9 req/s
API Success: 100%

Soil Temperatures

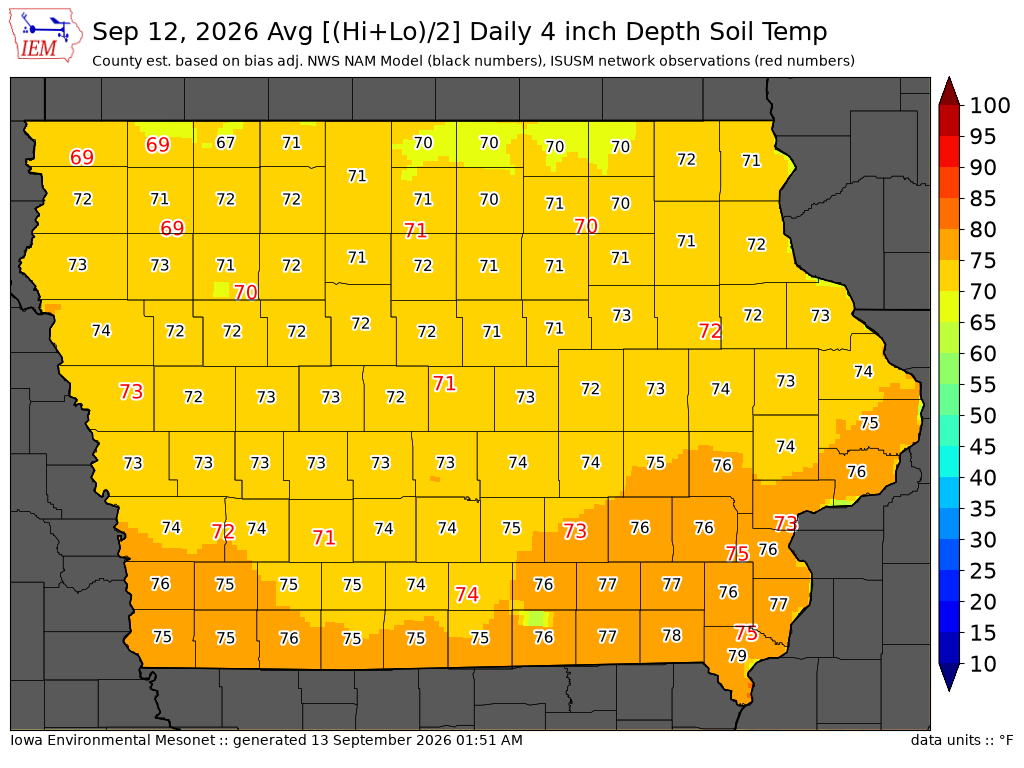
Data from the Iowa State Soil Moisture Network is found on this website and daily soil temperature averages are used to produce the highlighted analysis.
Current Data
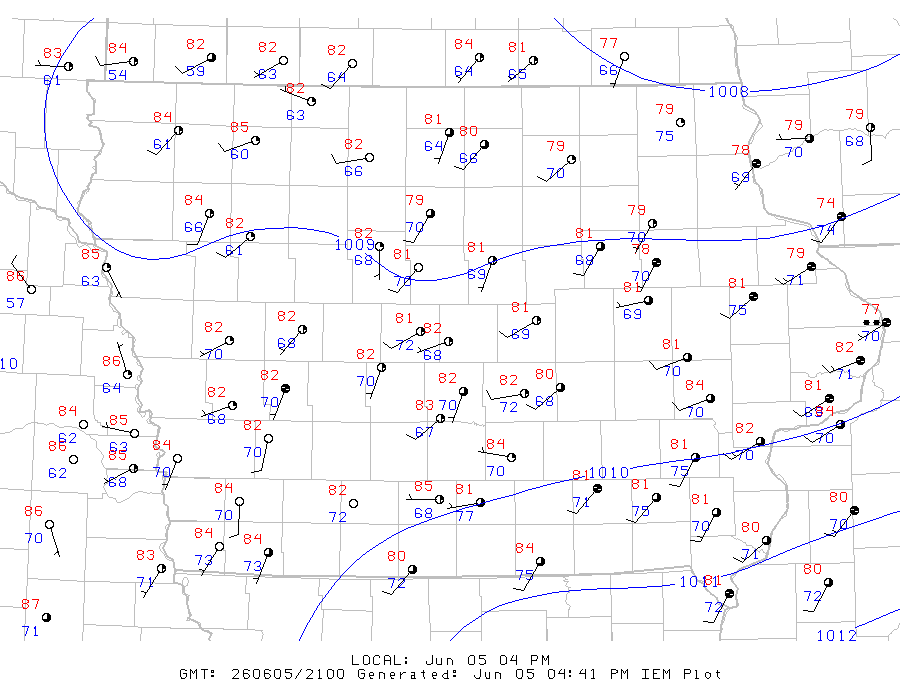
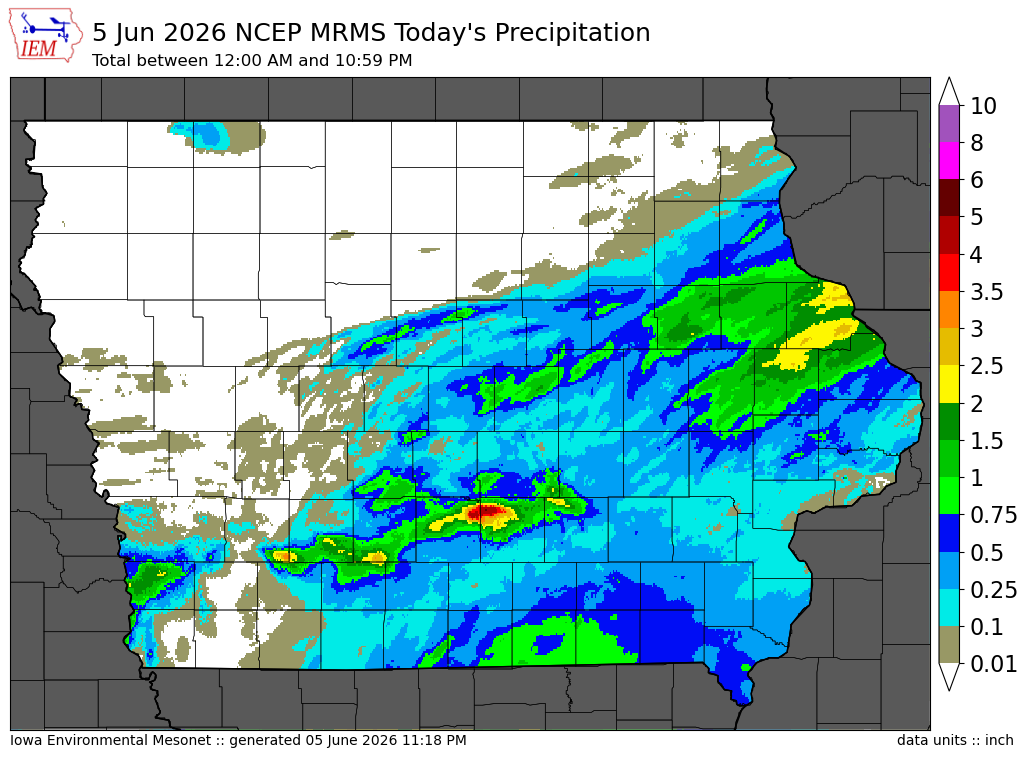
The IEM combines data from participating networks into products like maps shown above and web applications to analyze the data.

More current products »