The Iowa Environmental Mesonet (IEM) collects environmental data from cooperating members with observing networks. The data are stored and made available on this website.

IEM Daily Feature

Besting September 1914

Posted: 16 Sep 2026 05:30 AM, Views: 164
The precipitation totals for September continue to pile up as daily rounds of storms frequent the state. For Des Moines, the September 2026 total now stands at 10.52 inches and is the second largest total on record during the month of September behind 14.81" during 1914. With half of the month to go, it would seem "easy" to break this record, but the featured chart tells another story. The chart plots the accumulated precipitation total for 2026 (red line) and 1914 (black line). The tan lines represent the appending of previous year's 16-30 September data unto the 2026 time series. This effectively provides potential scenarios for where the 2026 total could end up. Using this method and remarkably, only 7.4% of previous years would push the 2026 total to a record value. The main issue is that the 2026 total is still 4.3 inches short of 1914 and that total in itself would be extreme for the last half of September. Climatology is also working against larger precipitation totals by the day as the atmosphere continues to cool and hold less water vapor. Having said all of that, the forecast looks to bring another two inches, at least, for the remainder of the week. So stay tuned!
Rate Feature

Previous Years' Features
Onawa (I-29), IA Webcam:
News Items  

5 Sep NWS Data Outage
Posted: 5 Sep 2:03 PM

4 Sep ISU Network Issue [resolved]
Posted: 4 Sep 11:03 AM

12 Aug Service Degradation [resolved]
Posted: 12 Aug 6:13 AM

MRMS Archive Downsizing
Posted: 9 Aug 4:15 PM

26-27 July 2026 Record Dew Points
Posted: 27 Jul 8:08 PM

Sign up for the Daily Bulletin

Current Website Performance:
Bandwidth: 77.7 MB/s
Total Website: 3,537 req/s
API/Data Services: 165.3 req/s
API Success: 100%

Soil Temperatures

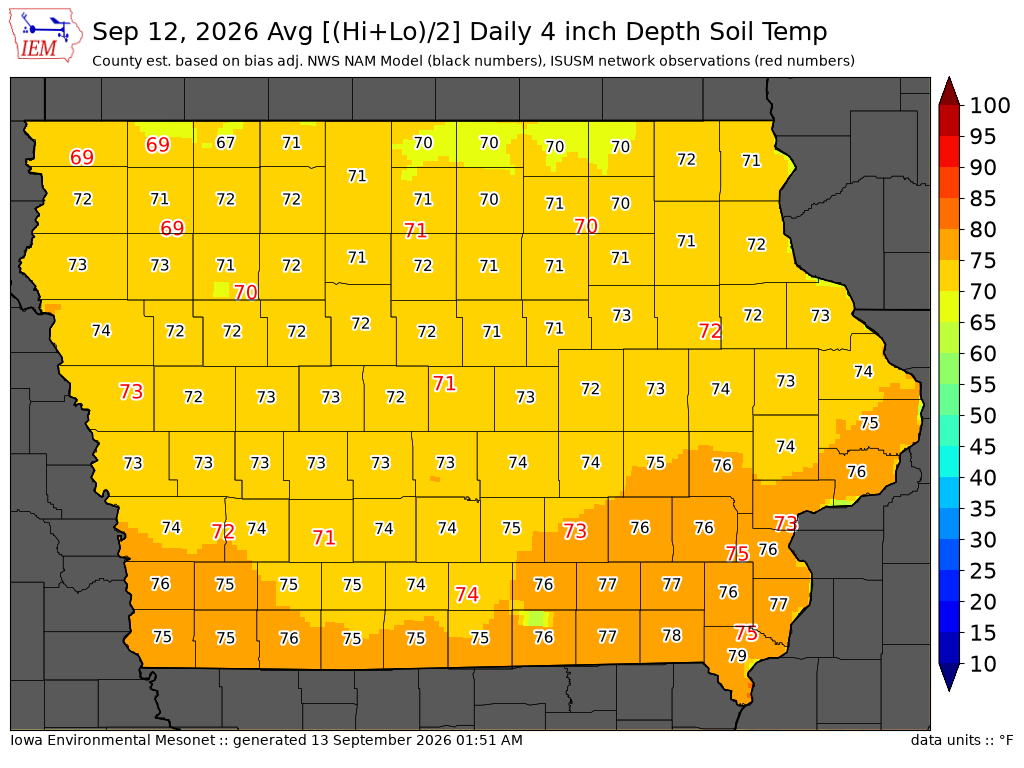
Data from the Iowa State Soil Moisture Network is found on this website and daily soil temperature averages are used to produce the highlighted analysis.
Current Data
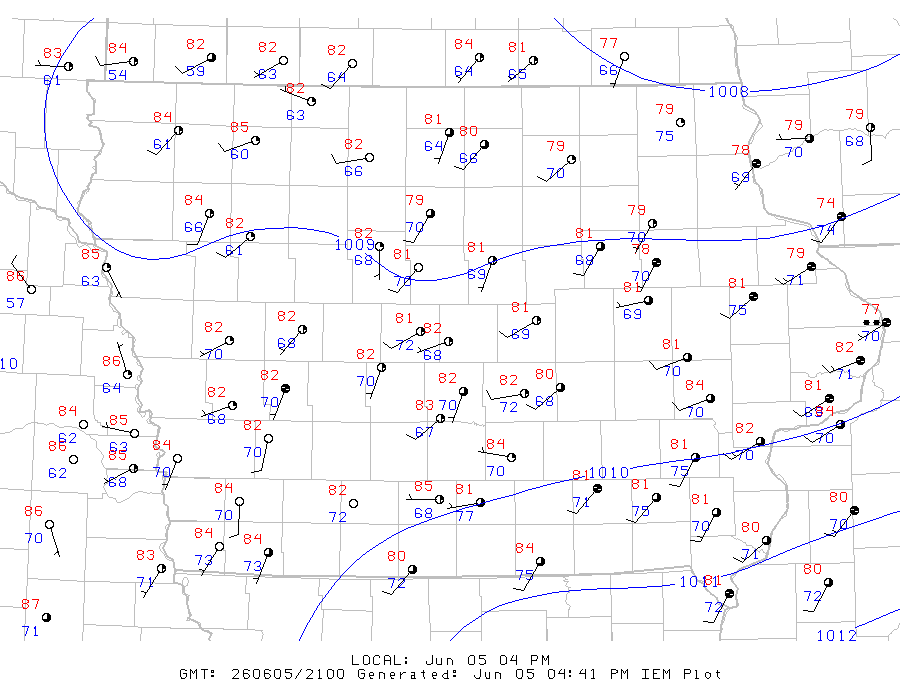
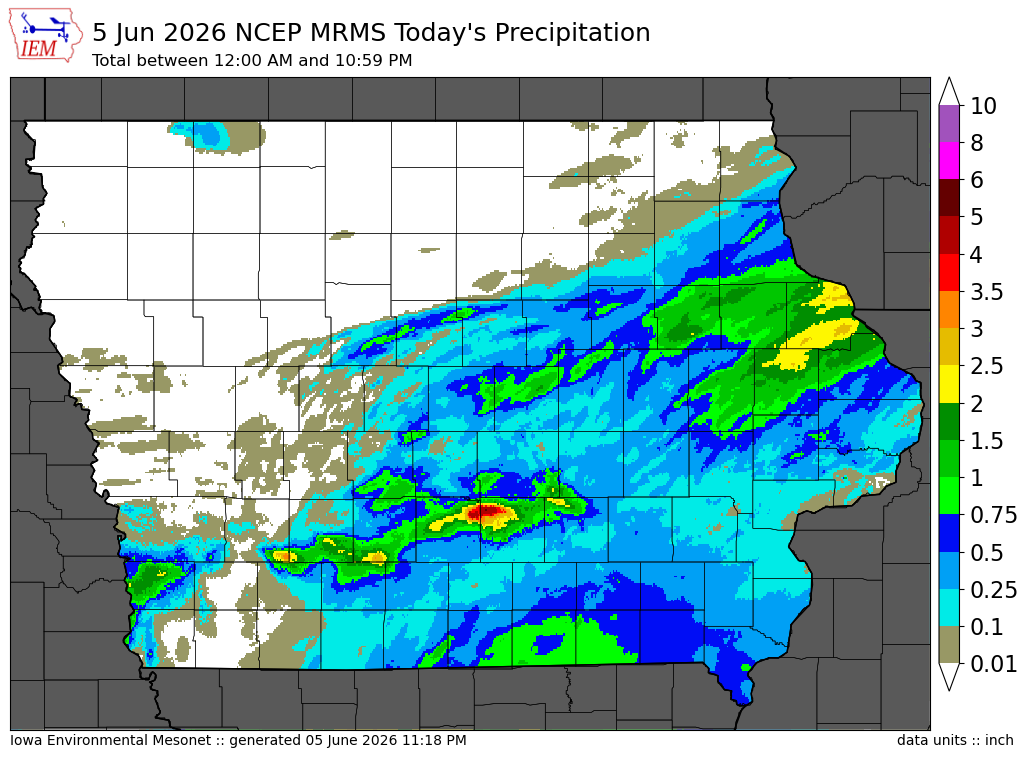
The IEM combines data from participating networks into products like maps shown above and web applications to analyze the data.

More current products »