The Iowa Environmental Mesonet (IEM) collects environmental data from cooperating members with observing networks. The data are stored and made available on this website.
Precip Metrics for Spencer
Posted: 10 Jul 2026 05:30 AM, Views: 118The weekly update to the US Drought Monitor was released Thursday morning and while most of Iowa is drought free, pockets of dryness continue to fester over northcentral and northwestern Iowa. One of the driest long term reporting locations as of late has been Spencer. The featured chart presents a number of precipitation metrics for the site. The individual graphs are best interpreted by reading them right to left as they display trailing period metrics for the plotted date up until 9 July. The right side (near term) values are a bit noisy as a recent rainfall event skews metrics over a short duration of time. The bottom left panel plot is probably the most informative as it plots standardized precipitation index (SPI) with the associated drought thresholds. Departures do not get too far out of hand until you reach back into early fall 2025.
Rate Feature
Previous Years' Features
2021Prolific Hailer
2020Missed the D1
2018GFS MOS
2017Past 24 Days
2014Drought Changes
2012Some got lucky
2009Windy wake low
2008Northwest flow
2003Way above normal
Spencer US 18 East View, IA Webcam:
Most Popular (List Apps)
ISU Network Outage [resolved]
Posted: 12 May 11:06 PM
1 April IEM Outage [resolved]
Posted: 2 Apr 10:55 AM
Tracking TAF Amendments
Posted: 13 Feb 10:28 AM
IEM Archival Update
Posted: 24 Sep 11:07 PM
TAF Archive Fixes
Posted: 22 Aug 7:28 AM
Sign up for the Daily Bulletin
Current Website Performance:
Bandwidth: 54.7 MB/s
Total Website: 2,950 req/s
API/Data Services: 126.5 req/s
API Success: 100%
Soil Temperatures
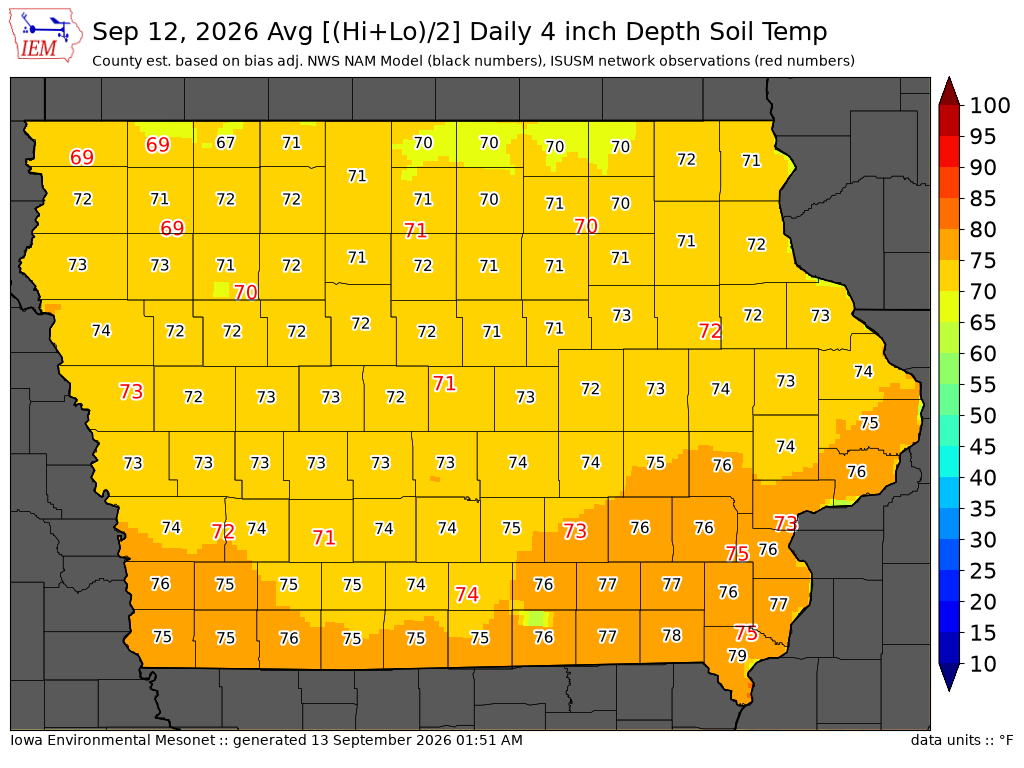
Data from the Iowa State Soil Moisture Network is found on this website and daily soil temperature averages are used to produce the highlighted analysis.