The Iowa Environmental Mesonet (IEM) collects environmental data from cooperating members with observing networks. The data are stored and made available on this website.

Before and After 1 August
Posted: 03 Aug 2026 05:30 AM, Views: 442
Previous Years' Features

26-27 July 2026 Record Dew Points
Posted: 27 Jul 8:08 PM
ISU Network Outage [resolved]
Posted: 12 May 11:06 PM
1 April IEM Outage [resolved]
Posted: 2 Apr 10:55 AM
Tracking TAF Amendments
Posted: 13 Feb 10:28 AM
IEM Archival Update
Posted: 24 Sep 11:07 PM
Sign up for the Daily Bulletin
Soil Temperatures
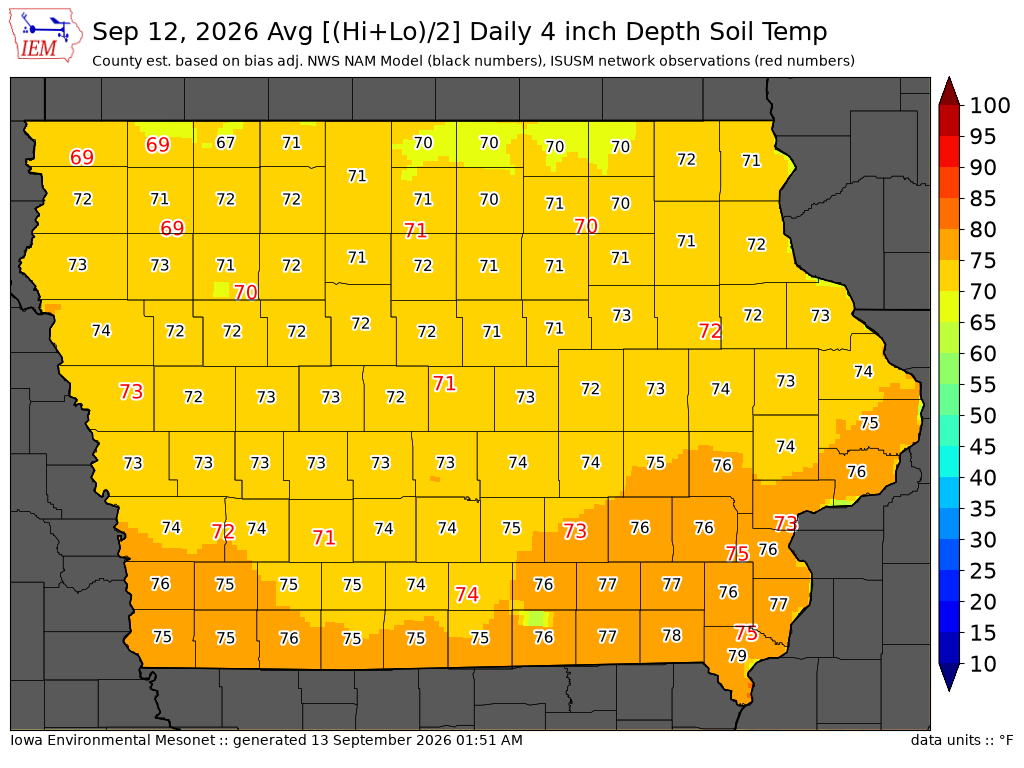
Data from the Iowa State Soil Moisture Network is found on this website and daily soil temperature averages are used to produce the highlighted analysis.
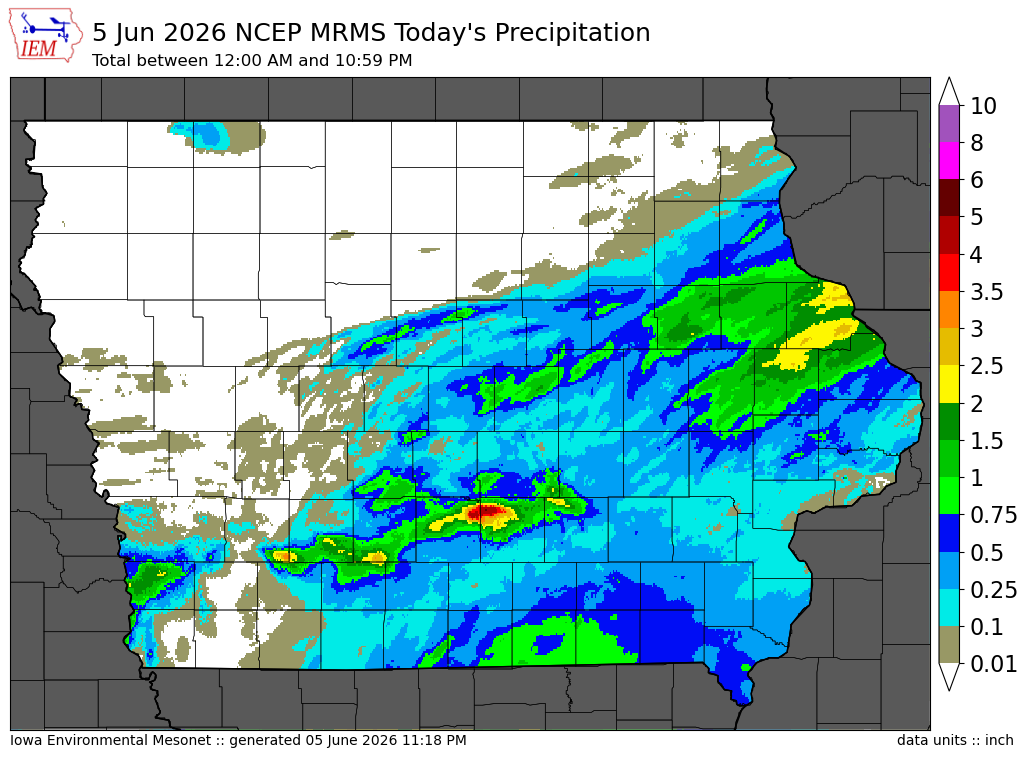
Current Data
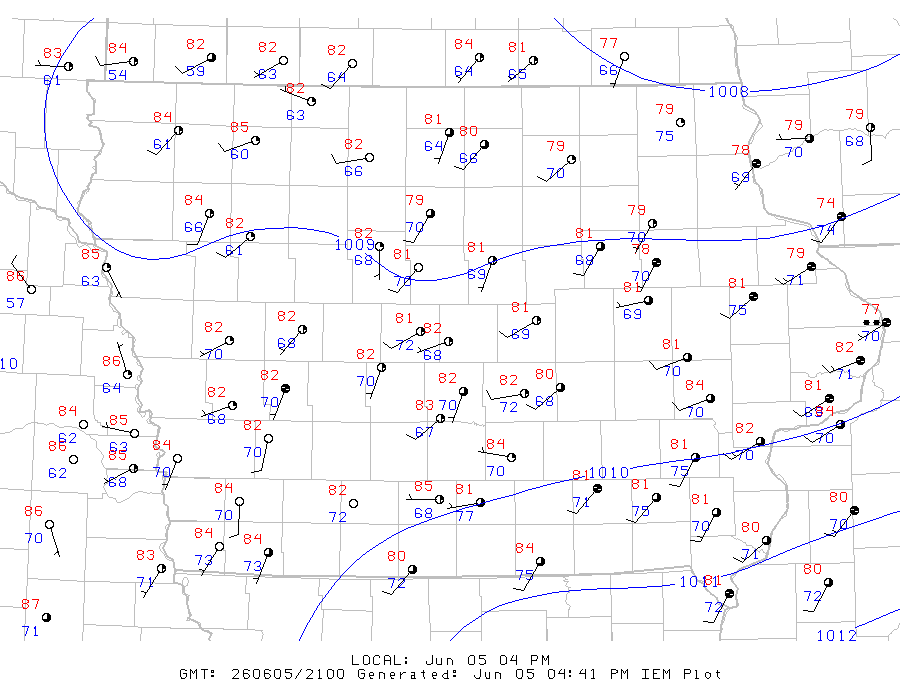
The IEM combines data from participating networks into products like maps shown above and web applications to analyze the data.