The Iowa Environmental Mesonet (IEM) collects environmental data from cooperating members with observing networks. The data are stored and made available on this website.

IEM Daily Feature

August Weather + Yield

Posted: 25 Aug 2026 05:30 AM, Views: 417
Yesterday's daily feature speculated about the upcoming crop yield impact of low solar radiation days during much of this August. Today's featured chart takes a more direct look into this by comparing various weather summary values over the 1-24 August period for Ames to de-trended corn yield departures for Boone County (the county the weather station resides). The top left panel shows the yearly NASS county corn yield estimates with a number of fits plotted. The red line denotes the simple linear trend and is used to compute a yearly departure value used within all other sub-plots. Eight different yearly weather summary values are plotted against this de-trended yield value. Of note for today is the upper left most plot showing daily average solar radiation as estimated by ERA5-Land. Since long term observations of solar radiation generally do not exist, a model is used to estimate the daily values. At least for this plotted metric, the relationship is not all that exciting as a simple explainer for yield outcomes. As is the general comment for plots in this space, if the relationship was simple/easy, folks would be making a fortune in the futures market!
Rate Feature

Previous Years' Features
Decorah, IA Webcam:
News Items  

12 Aug Service Degradation [resolved]
Posted: 12 Aug 6:13 AM

MRMS Archive Downsizing
Posted: 9 Aug 4:15 PM

26-27 July 2026 Record Dew Points
Posted: 27 Jul 8:08 PM

ISU Network Outage [resolved]
Posted: 12 May 11:06 PM

1 April IEM Outage [resolved]
Posted: 2 Apr 10:55 AM

Sign up for the Daily Bulletin

Current Website Performance:
Bandwidth: 74.1 MB/s
Total Website: 4,096 req/s
API/Data Services: 168.5 req/s
API Success: 100%

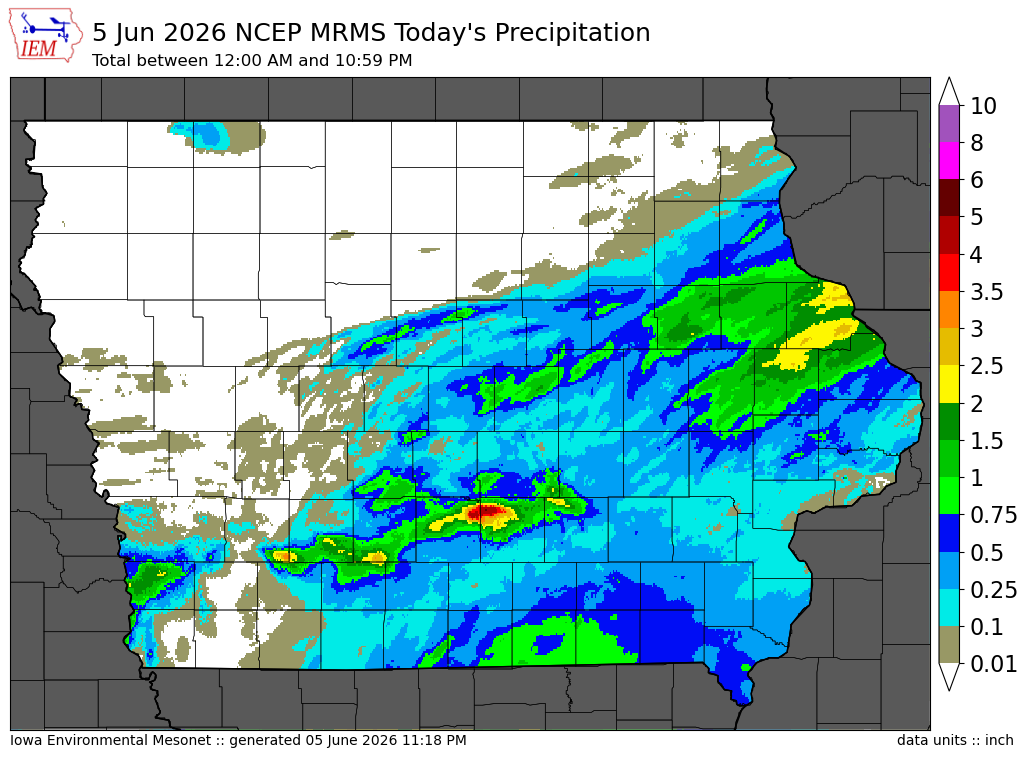
Soil Temperatures

Data from the Iowa State Soil Moisture Network is found on this website and daily soil temperature averages are used to produce the highlighted analysis.
Current Data
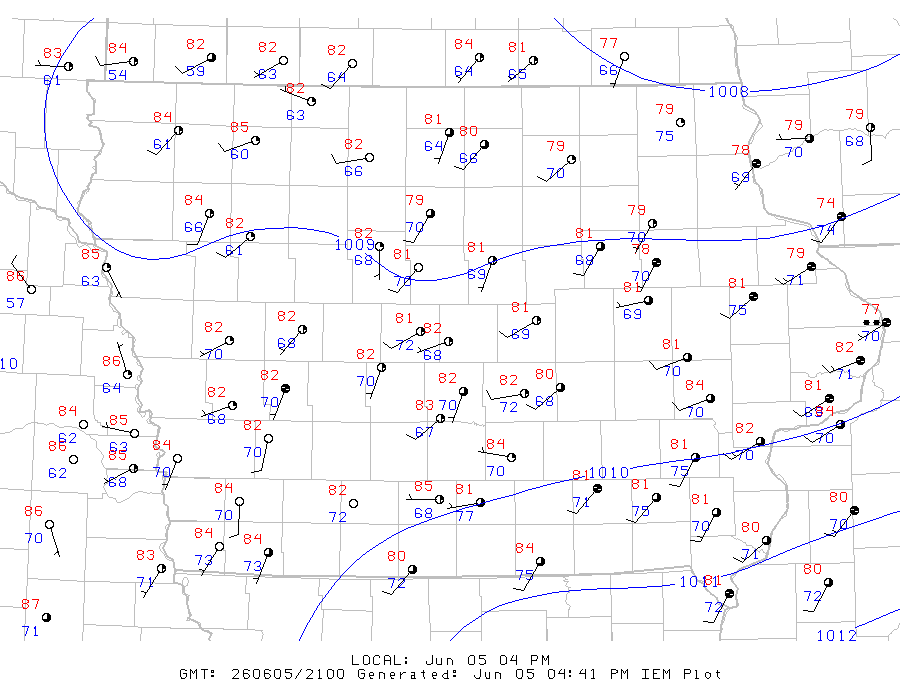
The IEM combines data from participating networks into products like maps shown above and web applications to analyze the data.

More current products »