The Iowa Environmental Mesonet (IEM) collects environmental data from cooperating members with observing networks. The data are stored and made available on this website.
Des Moines Heat Island
Posted: 08 Jul 2026 05:30 AM, Views: 511Tags: heatisland
With a low temperature of 70°F on Tuesday, the Des Moines airport weather station was the warmest within Iowa among airport based weather stations. This situation happens frequently for the site due to the urban heat island effect being the strongest for the most urban airport weather sensor within Iowa. The featured chart illustrates this by computing the average low temperature percentile for Des Moines vs the rest of the long term climate stations within Iowa. Please note that there was no spatial weighting done, it is just a simple comparison. The bottom panel shows the bias between the Des Moines average value vs the rest of the state. The increasing impact of the heat island is readily apparent, but you may wonder what is happening during the early period prior to ~1940. This was approximately when the station moved from downtown to the present location, which was more rural at the time. Additionally, observation techniques changed with most of the rest of the state reporting 24 hour values during the afternoon hours, which tends to bias low temperatures warmer.
Rate Feature
Previous Years' Features
2025IEM One App
2021July Lows
2019Two Week Totals
201570s in July
2011Barely any wind
2010Waterloo Event
2009A few inches
2002Foggy
Chariton River, IA Webcam:
Most Popular (List Apps)
ISU Network Outage [resolved]
Posted: 12 May 11:06 PM
1 April IEM Outage [resolved]
Posted: 2 Apr 10:55 AM
Tracking TAF Amendments
Posted: 13 Feb 10:28 AM
IEM Archival Update
Posted: 24 Sep 11:07 PM
TAF Archive Fixes
Posted: 22 Aug 7:28 AM
Sign up for the Daily Bulletin
Current Website Performance:
Bandwidth: 75.0 MB/s
Total Website: 3,804 req/s
API/Data Services: 160.2 req/s
API Success: 100%
Soil Temperatures
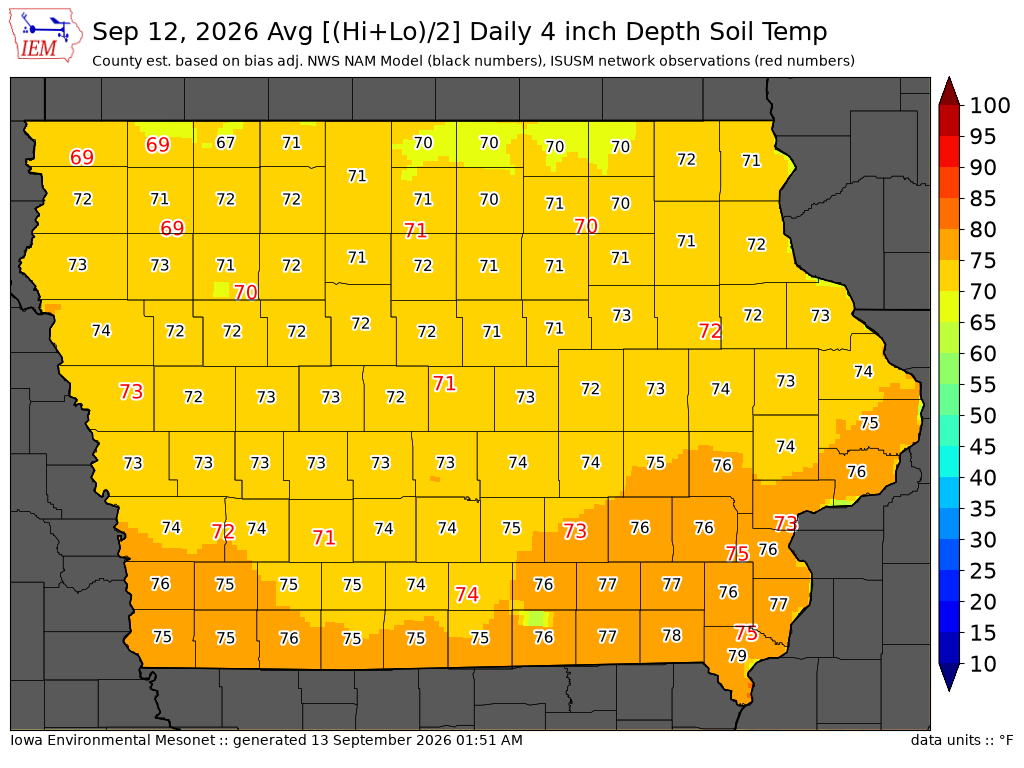
Data from the Iowa State Soil Moisture Network is found on this website and daily soil temperature averages are used to produce the highlighted analysis.