The following tables present IEM computed monthly data summaries based on
daily data provided by or computed for the IEM. A download interface
exists for the daily summary information. The climatology is provided by the
nearest NCEI climate station (USW00012975) within the current 1991-2020
dataset.
To load shown data into Microsoft Excel,
highlight the table information with your mouse and then copy/paste into Excel.
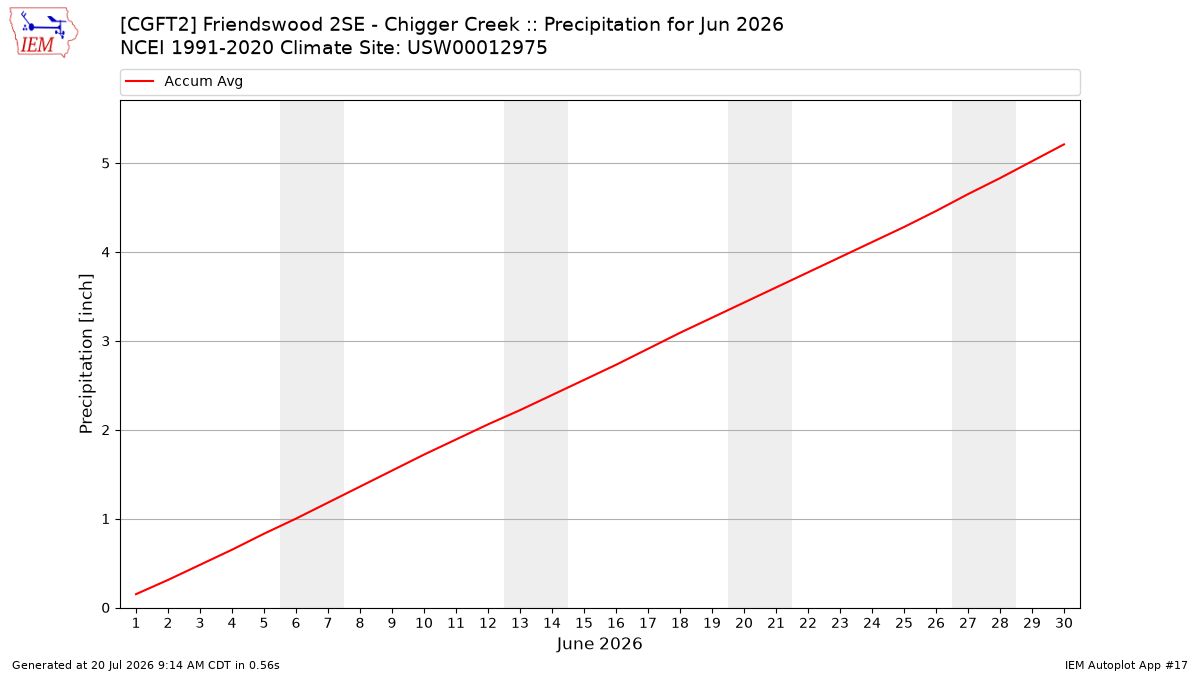
Precipitation Totals [inch]
Year
Jan
Feb
Mar
Apr
May
Jun
Jul
Aug
Sep
Oct
Nov
Dec
2022
M
M
240.56
1222.44
1362.76
1261.44
1171.16
1204.80
1338.16
1030.08
913.40
1188.80
2023
551.84
791.04
919.56
1224.84
1360.48
1110.20
1322.56
1391.68
1076.00
926.72
957.92
1119.48
2024
841.68
1287.60
1358.36
1276.92
1223.44
784.84
1072.76
1510.00
49.68
M
M
M
2025
596.68
960.92
1379.00
1349.04
1164.20
1149.24
801.16
922.76
1068.80
1092.36
1104.44
1275.88
2026
397.76
705.60
1019.64
737.16
M
M
M
M
M
M
M
M
NCEI Climatology
3.63
3.06
2.84
3.67
5.13
5.21
4.21
5.63
5.40
5.77
4.21
4.68
Average Wind Speed [MPH]
Year
Jan
Feb
Mar
Apr
May
Jun
Jul
Aug
Sep
Oct
Nov
Dec
2022
M
M
M
M
M
M
M
M
M
M
M
M
2023
M
M
M
M
M
M
M
M
M
M
M
M
2024
M
M
M
M
M
M
M
M
M
M
M
M
2025
M
M
M
M
M
M
M
M
M
M
M
M
2026
M
M
M
M
M
M
M
M
M
M
M
M
NCEI Climatology
M
M
M
M
M
M
M
M
M
M
M
M
Average Daily High Temperature [F]
Year
Jan
Feb
Mar
Apr
May
Jun
Jul
Aug
Sep
Oct
Nov
Dec
2022
M
M
M
M
M
M
M
M
M
M
M
M
2023
M
M
M
M
M
M
M
M
M
M
M
M
2024
M
M
M
M
M
M
M
M
M
M
M
M
2025
M
M
M
M
M
M
M
M
M
M
M
M
2026
M
M
M
M
M
M
M
M
M
M
M
M
NCEI Climatology
64.60
68.39
74.00
79.51
85.99
91.40
93.30
93.99
89.90
82.90
73.30
66.40
Average Daily Low Temperature [F]
Year
Jan
Feb
Mar
Apr
May
Jun
Jul
Aug
Sep
Oct
Nov
Dec
2022
M
M
M
M
M
M
M
M
M
M
M
M
2023
M
M
M
M
M
M
M
M
M
M
M
M
2024
M
M
M
M
M
M
M
M
M
M
M
M
2025
M
M
M
M
M
M
M
M
M
M
M
M
2026
M
M
M
M
M
M
M
M
M
M
M
M
NCEI Climatology
46.00
50.19
55.40
61.50
69.50
75.30
76.20
76.19
72.29
63.29
53.69
47.90
Average Daily Temperature (high+low)/2 [F]
Year
Jan
Feb
Mar
Apr
May
Jun
Jul
Aug
Sep
Oct
Nov
Dec
2022
M
M
M
M
M
M
M
M
M
M
M
M
2023
M
M
M
M
M
M
M
M
M
M
M
M
2024
M
M
M
M
M
M
M
M
M
M
M
M
2025
M
M
M
M
M
M
M
M
M
M
M
M
2026
M
M
M
M
M
M
M
M
M
M
M
M
NCEI Climatology
55.30
59.29
64.70
70.50
77.75
83.35
84.75
85.09
81.10
73.10
63.50
57.15
Average Relative Humidity [%]
This value is computed via a simple average of available observations weighted
by the duration between observations.