| May 2026 | Jun 2026 | Jul 2026 | ||||
|---|---|---|---|---|---|---|
| Sunday | Monday | Tuesday | Wednesday | Thursday | Friday | Saturday |
| 31 | 01 High: 82.994 Low: 53.816 Precip: M RH% Min/Max: 7-29 Feel Min/Max: 54 to 80 | 02 High: 82.058 Low: 54.824 Precip: M RH% Min/Max: 7-27 Feel Min/Max: 55 to 79 | 03 High: 79.736 Low: 50.648 Precip: M RH% Min/Max: 7-29 Feel Min/Max: 51 to 80 | 04 High: 79.718 Low: 52.97 Precip: M RH% Min/Max: 7-28 Feel Min/Max: 53 to 80 | 05 High: 76.784 Low: 52.556 Precip: M RH% Min/Max: 12-56 Feel Min/Max: 53 to 77 | 06 High: 76.748 Low: 51.152 Precip: M RH% Min/Max: 12-38 Feel Min/Max: 51 to 77 |
| 07 High: 77.702 Low: 51.188 Precip: M RH% Min/Max: 9-48 Feel Min/Max: 51 to 78 | 08 High: 77.432 Low: 52.268 Precip: M RH% Min/Max: 11-48 Feel Min/Max: 52 to 77 | 09 High: 70.628 Low: 50.378 Precip: M RH% Min/Max: 15-46 Feel Min/Max: 50 to 71 | 10 High: 73.76 Low: 49.802 Precip: M RH% Min/Max: 17-52 Feel Min/Max: 50 to 74 | 11 High: 75.758 Low: 49.73 Precip: M RH% Min/Max: 12-40 Feel Min/Max: 50 to 76 | 12 High: 77.648 Low: 50.324 Precip: M RH% Min/Max: 5-34 Feel Min/Max: 50 to 78 | 13 Precip: M |
| 14 | 15 | 16 | 17 | 18 | 19 | 20 |
| 21 | 22 | 23 | 24 | 25 | 26 | 27 |
| 28 | 29 | 30 | 01 | 02 | 03 | 04 |
The data presented here provided by IEM API webservice: daily.json. A simple CSV option exists as well.
Daily High/Low Plot
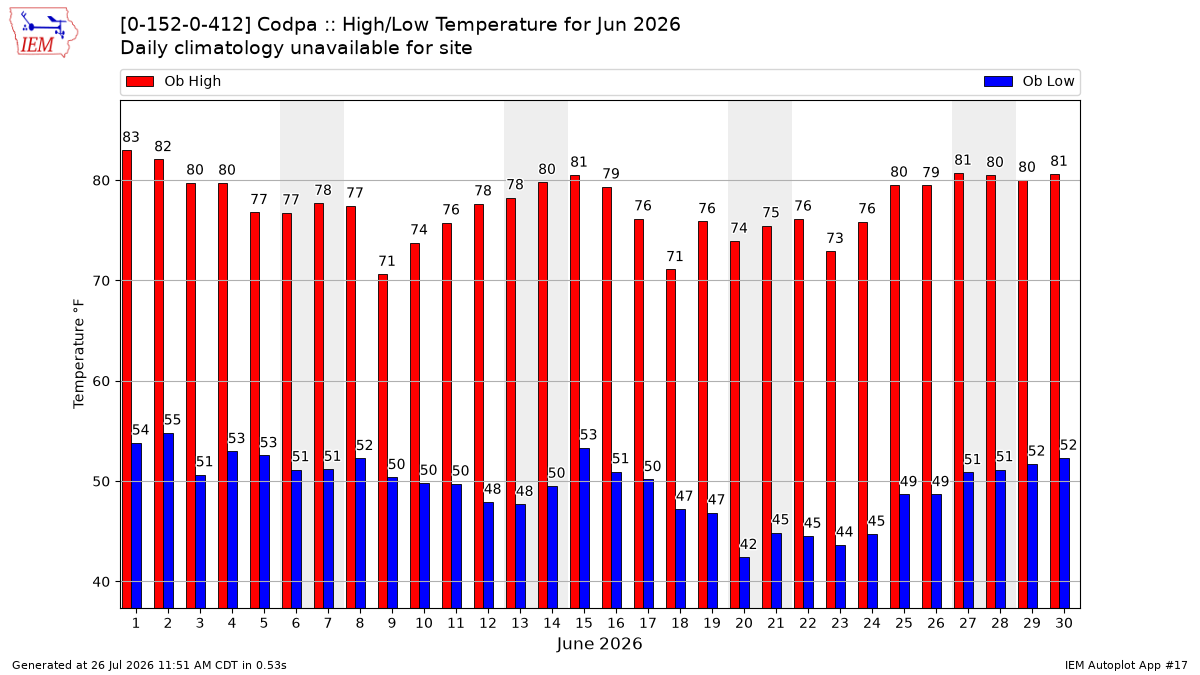
Description: This chart of the monthly temperature data. The bars are the observations and the dots are climatology.
Daily Rainfall
Description: This chart is of daily precipitation for the month. The red line would be an average month while the blue line and bars are observations.
Daily Average Wind Speeds

Description: This chart is of the daily average wind speeds.
The data presented here provided by IEM API webservice: daily.json. A simple CSV option exists as well.