| May 2026 | Jun 2026 | Jul 2026 | ||||
|---|---|---|---|---|---|---|
| Sunday | Monday | Tuesday | Wednesday | Thursday | Friday | Saturday |
| 31 | 01 High: 77.0396 Low: 52.53981 Precip: M Avg Wind: NE @ 7.4 Gust: 23 (11:00 PM) RH% Min/Max: 17-56 Feel Min/Max: 53 to 77 | 02 High: 77.84962 Low: 59.160225 Precip: M Avg Wind: NNE @ 8.2 Gust: 22 (6:10 PM) RH% Min/Max: 19-51 Feel Min/Max: 59 to 78 | 03 High: 87.69919 Low: 57.250416 Precip: M Avg Wind: NE @ 6.1 Gust: 20 (7:20 PM) RH% Min/Max: 12-48 Feel Min/Max: 57 to 84 | 04 High: 83.100204 Low: 64.41982 Precip: M Avg Wind: NE @ 8.0 Gust: 22 (4:50 PM) RH% Min/Max: 15-45 Feel Min/Max: 64 to 80 | 05 High: 87.79999 Low: 64.29919 Precip: M Avg Wind: NE @ 7.5 Gust: 20 (2:50 PM) RH% Min/Max: 16-46 Feel Min/Max: 64 to 85 | 06 High: 94.60042 Low: 72.23 Precip: M Avg Wind: SSW @ 13.6 Gust: 39 (4:20 PM) RH% Min/Max: 7-33 Feel Min/Max: 72 to 88 |
| 07 High: 77.39061 Low: 62.97078 Precip: M Avg Wind: NNE @ 10.8 Gust: 30 (8:20 PM) RH% Min/Max: 19-50 Feel Min/Max: 63 to 77 | 08 High: 84.59962 Low: 55.169605 Precip: M Avg Wind: SW @ 8.5 Gust: 36 (10:50 PM) RH% Min/Max: 10-39 Feel Min/Max: 55 to 81 | 09 High: 80.4002 Low: 64.189384 Precip: M Avg Wind: NNE @ 9.7 Gust: 37 (3:10 AM) RH% Min/Max: 13-56 Feel Min/Max: 64 to 80 | 10 High: 78.440025 Low: 56.03 Precip: M Avg Wind: NE @ 8.2 Gust: 37 (8:10 PM) RH% Min/Max: 14-55 Feel Min/Max: 56 to 78 | 11 High: 69.63981 Low: 49.310596 Precip: M Avg Wind: NNE @ 6.5 Gust: 27 (12:00 AM) RH% Min/Max: 22-46 Feel Min/Max: 47 to 70 | 12 High: 83.800415 Low: 51.58037 Precip: M Avg Wind: NE @ 5.6 Gust: 19 (3:50 PM) RH% Min/Max: 11-43 Feel Min/Max: 52 to 81 | 13 High: 82.00042 Low: 57.77957 Precip: M Avg Wind: NNE @ 7.7 Gust: 23 (1:30 PM) RH% Min/Max: 14-41 Feel Min/Max: 58 to 80 |
| 14 High: 83.699615 Low: 61.550575 Precip: M Avg Wind: NNE @ 6.2 Gust: 18 (2:20 PM) RH% Min/Max: 14-44 Feel Min/Max: 62 to 81 | 15 High: 84.59962 Low: 61.210384 Precip: M Avg Wind: NNE @ 6.1 Gust: 20 (4:30 PM) RH% Min/Max: 14-44 Feel Min/Max: 61 to 82 | 16 High: 91.39999 Low: 63.860012 Precip: M Avg Wind: S @ 5.2 Gust: 16 (6:20 PM) RH% Min/Max: 9-36 Feel Min/Max: 64 to 86 | 17 High: 88.199615 Low: 69.069176 Precip: M Avg Wind: NE @ 6.3 Gust: 22 (4:10 PM) RH% Min/Max: 9-35 Feel Min/Max: 69 to 84 | 18 High: 83.699615 Low: 60.859425 Precip: M Avg Wind: NE @ 6.2 Gust: 23 (12:30 AM) RH% Min/Max: 8-35 Feel Min/Max: 61 to 81 | 19 High: 90.3002 Low: 62.07979 Precip: M Avg Wind: NE @ 8.1 Gust: 22 (3:00 PM) RH% Min/Max: 11-41 Feel Min/Max: 62 to 86 | 20 High: 86.300575 Low: 74.22078 Precip: M Avg Wind: NE @ 11.2 Gust: 31 (7:20 PM) RH% Min/Max: 11-42 Feel Min/Max: 74 to 83 |
| 21 High: 83.40079 Low: 61.550575 Precip: M Avg Wind: NE @ 8.2 Gust: 23 (1:10 AM) RH% Min/Max: 17-51 Feel Min/Max: 62 to 81 | 22 High: 88.80079 Low: 64.45042 Precip: M Avg Wind: NE @ 7.1 Gust: 20 (4:30 PM) RH% Min/Max: 17-48 Feel Min/Max: 64 to 85 | 23 High: 93.09919 Low: 65.39002 Precip: M Avg Wind: NNE @ 6.8 Gust: 19 (3:50 PM) RH% Min/Max: 10-41 Feel Min/Max: 65 to 89 | 24 High: 96.40041 Low: 73.2308 Precip: M Avg Wind: SSW @ 10.5 Gust: 44 (8:50 PM) RH% Min/Max: 12-49 Feel Min/Max: 73 to 92 | 25 High: 89.20042 Low: 63.759212 Precip: M Avg Wind: ENE @ 5.9 Gust: 29 (5:10 PM) RH% Min/Max: 16-64 Feel Min/Max: 64 to 86 | 26 High: 95.79919 Low: 70.500206 Precip: M Avg Wind: SW @ 15.2 Gust: 40 (1:30 PM) RH% Min/Max: 5-42 Feel Min/Max: 71 to 89 | 27 High: 73.729416 Low: 65.67078 Precip: M Gust: 33 (1:40 PM) RH% Min/Max: 29-58 Feel Min/Max: 66 to 74 |
| 28 Precip: M | 29 | 30 | 01 | 02 | 03 | 04 |
The data presented here provided by IEM API webservice: daily.json. A simple CSV option exists as well.
Daily High/Low Plot
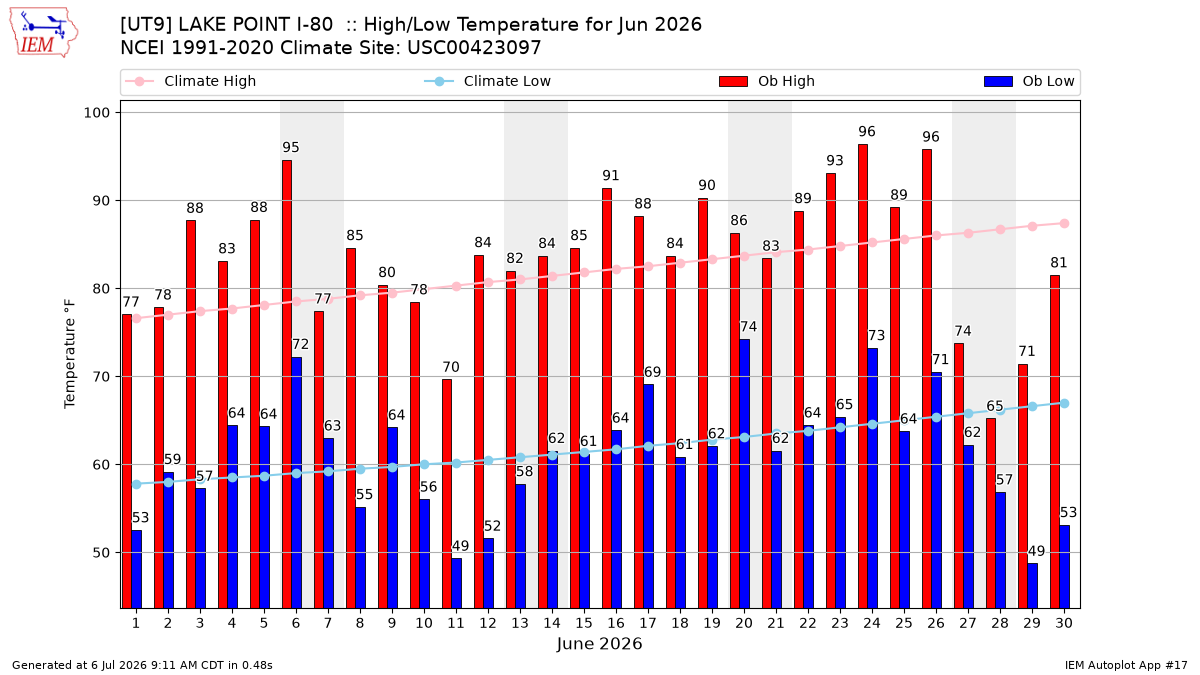
Description: This chart of the monthly temperature data. The bars are the observations and the dots are climatology.
Daily Rainfall
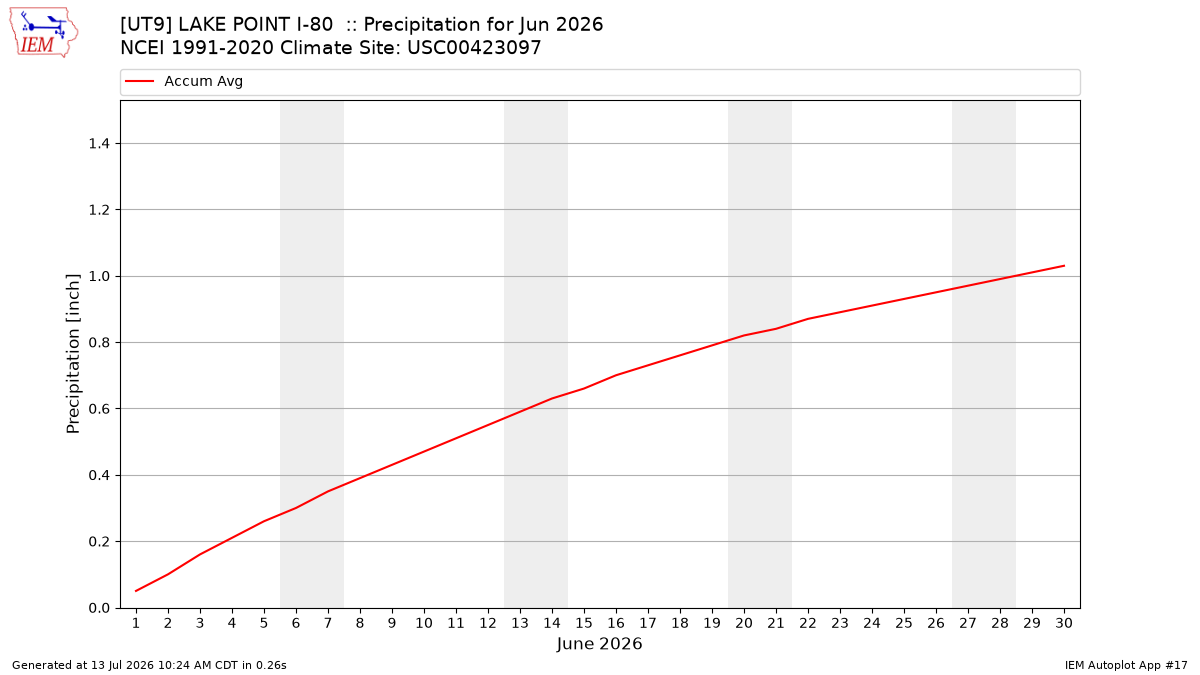
Description: This chart is of daily precipitation for the month. The red line would be an average month while the blue line and bars are observations.
Daily Average Wind Speeds
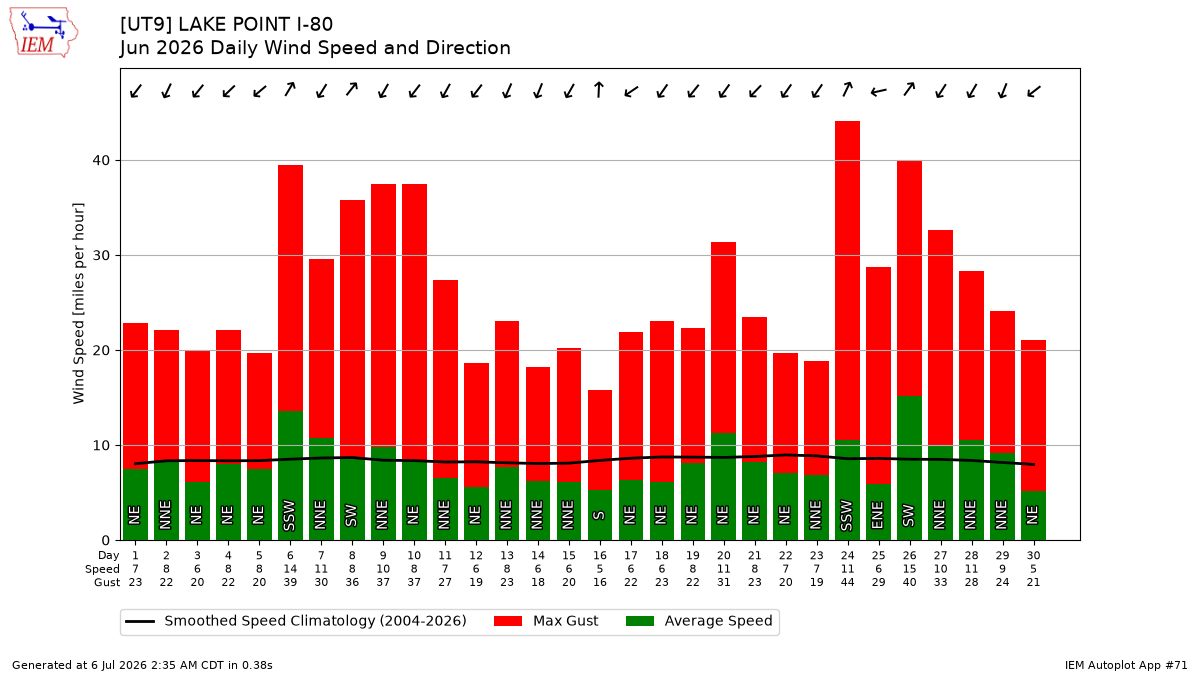
Description: This chart is of the daily average wind speeds.
The data presented here provided by IEM API webservice: daily.json. A simple CSV option exists as well.