| May 2026 | Jun 2026 | Jul 2026 | ||||
|---|---|---|---|---|---|---|
| Sunday | Monday | Tuesday | Wednesday | Thursday | Friday | Saturday |
| 31 | 01 High: 67.42941 Low: 45.860012 Precip: M Avg Wind: NW @ 1.3 RH% Min/Max: 46-98 Feel Min/Max: 46 to 67 | 02 High: 77.430214 Low: 41.540024 Precip: M Avg Wind: W @ 1.1 RH% Min/Max: 27-98 Feel Min/Max: 42 to 77 | 03 High: 82.59978 Low: 46.459427 Precip: M Avg Wind: W @ 1.1 RH% Min/Max: 24-97 Feel Min/Max: 46 to 81 | 04 High: 85.780426 Low: 48.050575 Precip: M Avg Wind: W @ 0.8 RH% Min/Max: 28-97 Feel Min/Max: 48 to 83 | 05 High: 88.48043 Low: 51.040394 Precip: M Avg Wind: WNW @ 0.7 RH% Min/Max: 27-98 Feel Min/Max: 51 to 87 | 06 High: 86.88922 Low: 58.36998 Precip: M Avg Wind: E @ 0.9 RH% Min/Max: 50-99 Feel Min/Max: 58 to 90 |
| 07 High: 82.84999 Low: 61.559586 Precip: M Avg Wind: WSW @ 1.2 RH% Min/Max: 46-100 Feel Min/Max: 62 to 83 | 08 High: 79.50921 Low: 56.330585 Precip: M Avg Wind: N @ 1.2 RH% Min/Max: 30-90 Feel Min/Max: 56 to 80 | 09 High: 82.839226 Low: 48.709427 Precip: M Avg Wind: ESE @ 0.9 RH% Min/Max: 42-96 Feel Min/Max: 49 to 83 | 10 High: 87.6308 Low: 57.77957 Precip: M Avg Wind: ESE @ 0.8 RH% Min/Max: 57-94 Feel Min/Max: 58 to 94 | 11 High: 93.03981 Low: 66.99919 Precip: M Avg Wind: WNW @ 0.8 RH% Min/Max: 56-100 Feel Min/Max: 67 to 107 | 12 High: 90.17963 Low: 69.96918 Precip: M Avg Wind: W @ 0.8 RH% Min/Max: 60-100 Feel Min/Max: 70 to 102 | 13 High: 85.560814 Low: 61.16001 Precip: M Avg Wind: W @ 1.0 RH% Min/Max: 44-100 Feel Min/Max: 61 to 87 |
| 14 High: 88.030426 Low: 58.159424 Precip: M Avg Wind: SSE @ 0.9 RH% Min/Max: 42-98 Feel Min/Max: 58 to 90 | 15 High: 76.249405 Low: 57.19999 Precip: M Avg Wind: WSW @ 1.3 RH% Min/Max: 48-99 Feel Min/Max: 57 to 76 | 16 High: 76.44919 Low: 48.399776 Precip: M Avg Wind: WSW @ 0.9 RH% Min/Max: 39-96 Feel Min/Max: 48 to 76 | 17 High: 81.699776 Low: 49.89919 Precip: M Avg Wind: ESE @ 0.9 RH% Min/Max: 39-97 Feel Min/Max: 50 to 81 | 18 High: 85.44018 Low: 63.179573 Precip: M Avg Wind: SSE @ 1.1 RH% Min/Max: 53-97 Feel Min/Max: 63 to 89 | 19 High: 81.48022 Low: 62.72062 Precip: M Avg Wind: WSW @ 1.2 RH% Min/Max: 39-71 Feel Min/Max: 63 to 82 | 20 High: 79.89082 Low: 56.469177 Precip: M Avg Wind: WSW @ 1.1 RH% Min/Max: 44-93 Feel Min/Max: 56 to 80 |
| 21 High: 80.78 Low: 51.13043 Precip: M Avg Wind: WNW @ 0.8 RH% Min/Max: 37-97 Feel Min/Max: 51 to 81 | 22 High: 64.29919 Low: 52.890823 Precip: M RH% Min/Max: 89-97 Feel Min/Max: 53 to 64 | 23 Precip: M | 24 | 25 | 26 | 27 |
| 28 | 29 | 30 | 01 | 02 | 03 | 04 |
The data presented here provided by IEM API webservice: daily.json. A simple CSV option exists as well.
Daily High/Low Plot
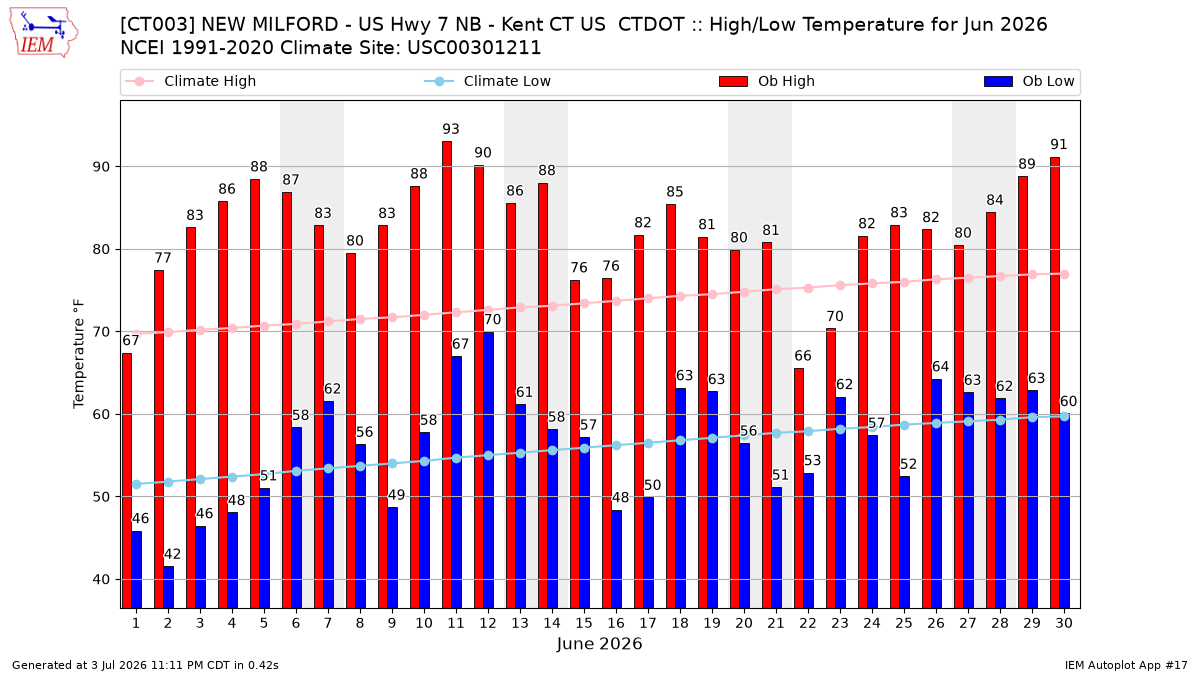
Description: This chart of the monthly temperature data. The bars are the observations and the dots are climatology.
Daily Rainfall
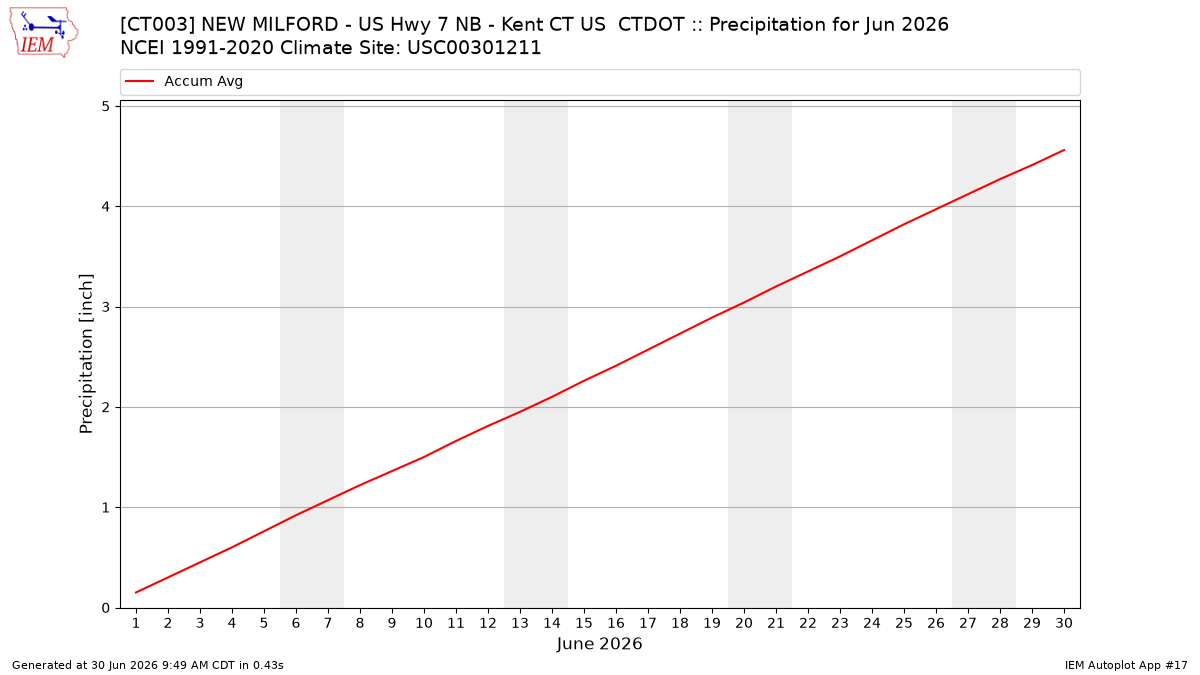
Description: This chart is of daily precipitation for the month. The red line would be an average month while the blue line and bars are observations.
Daily Average Wind Speeds
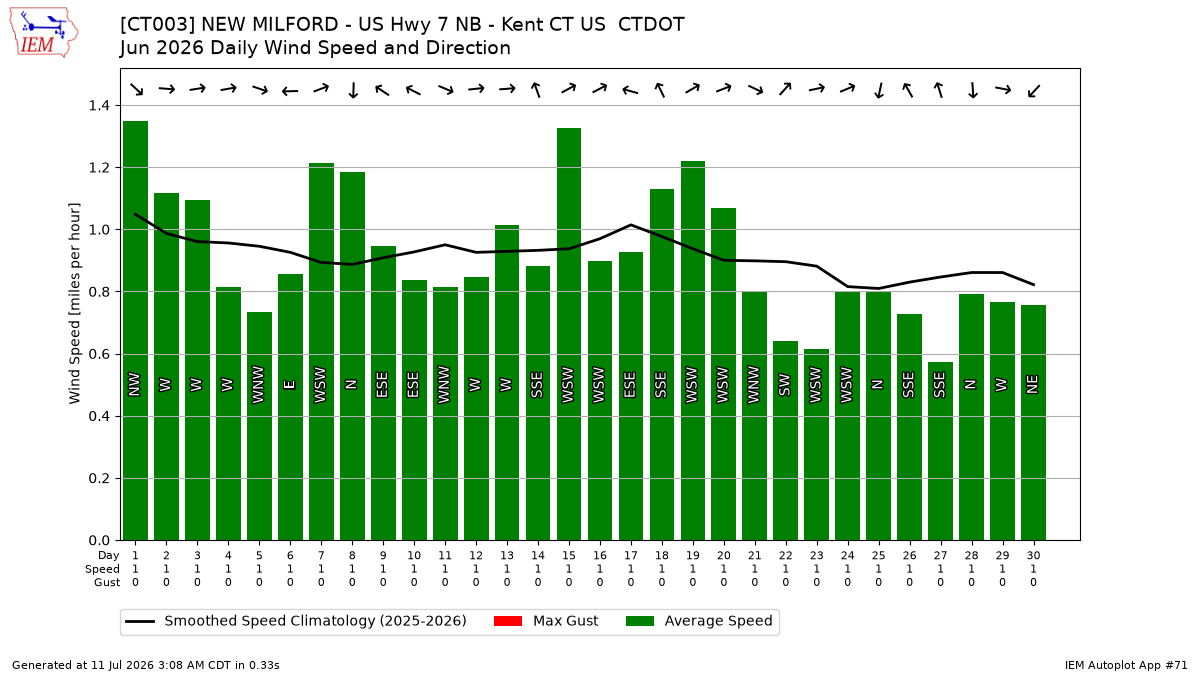
Description: This chart is of the daily average wind speeds.
The data presented here provided by IEM API webservice: daily.json. A simple CSV option exists as well.