The Iowa Environmental Mesonet (IEM) collects environmental data from cooperating members with observing networks. The data are stored and made available on this website.

About Those 90°F Dew Points
Posted: 30 Jul 2026 05:30 AM, Views: 418Tags: awos
- The 90°F dew point club (Clarion, Algona) are clearly having a problem with reporting too high of relative humidity (RH) and often "stuck" at 100% (first column). They are also reporting way too high RH during the afternoon hours (last column) vs all other sites over Iowa.
- The high RH frequencies, if accurate, would also imply reduced crop transpiration as saturated air can not take on more water vapor. This creates a conundrum for the theory that "corn sweat" can drive such high dew points when the sensor indicates high RH already.
- Ultimately, the very high dew points are just a sign of the sensor struggling to accurately measure humidity under extreme humidity levels. There is likely some water condensation within the sensor causing it to over-report humidity.
Recapping, "corn sweat" certainly drives higher dew point temperatures in Iowa and the effect is nicely documented with this Wolf and Market article. The effect can only push dew point temperatures so far into the lower 80s.

Previous Years' Features

26-27 July 2026 Record Dew Points
Posted: 27 Jul 8:08 PM
ISU Network Outage [resolved]
Posted: 12 May 11:06 PM
1 April IEM Outage [resolved]
Posted: 2 Apr 10:55 AM
Tracking TAF Amendments
Posted: 13 Feb 10:28 AM
IEM Archival Update
Posted: 24 Sep 11:07 PM
Sign up for the Daily Bulletin
Soil Temperatures
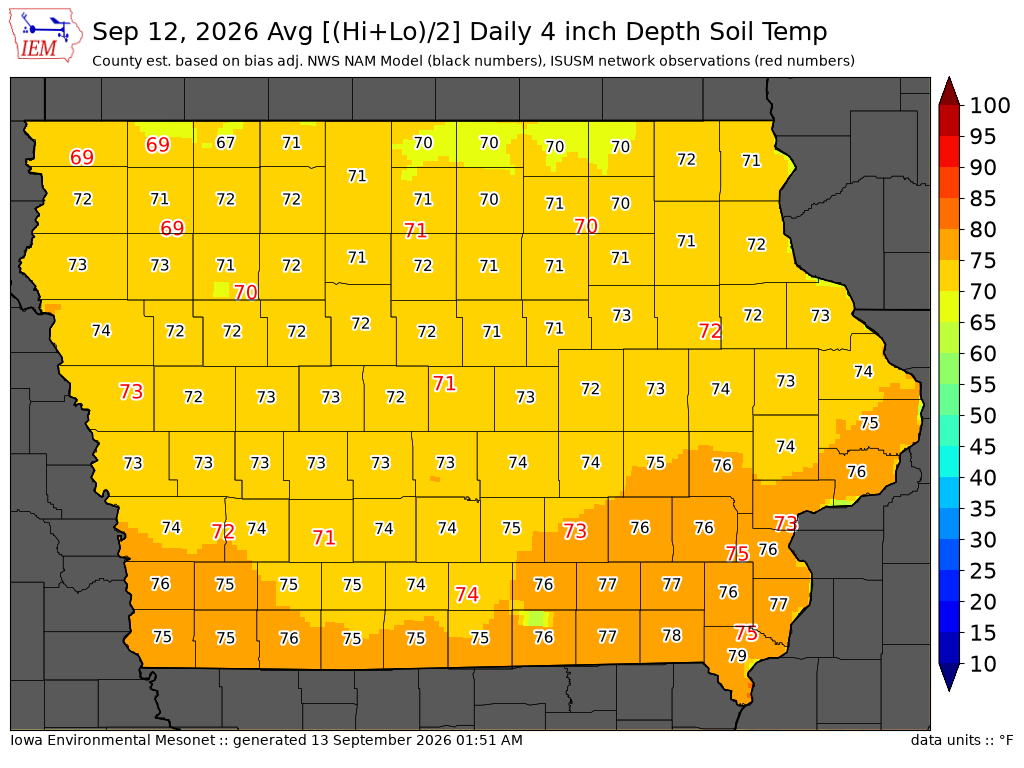
Data from the Iowa State Soil Moisture Network is found on this website and daily soil temperature averages are used to produce the highlighted analysis.
Current Data
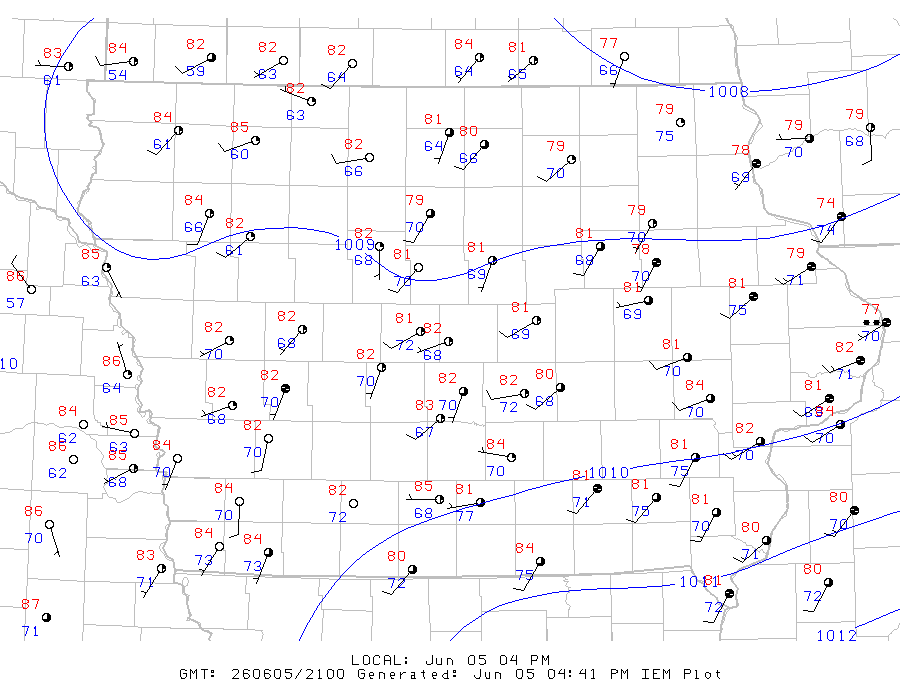
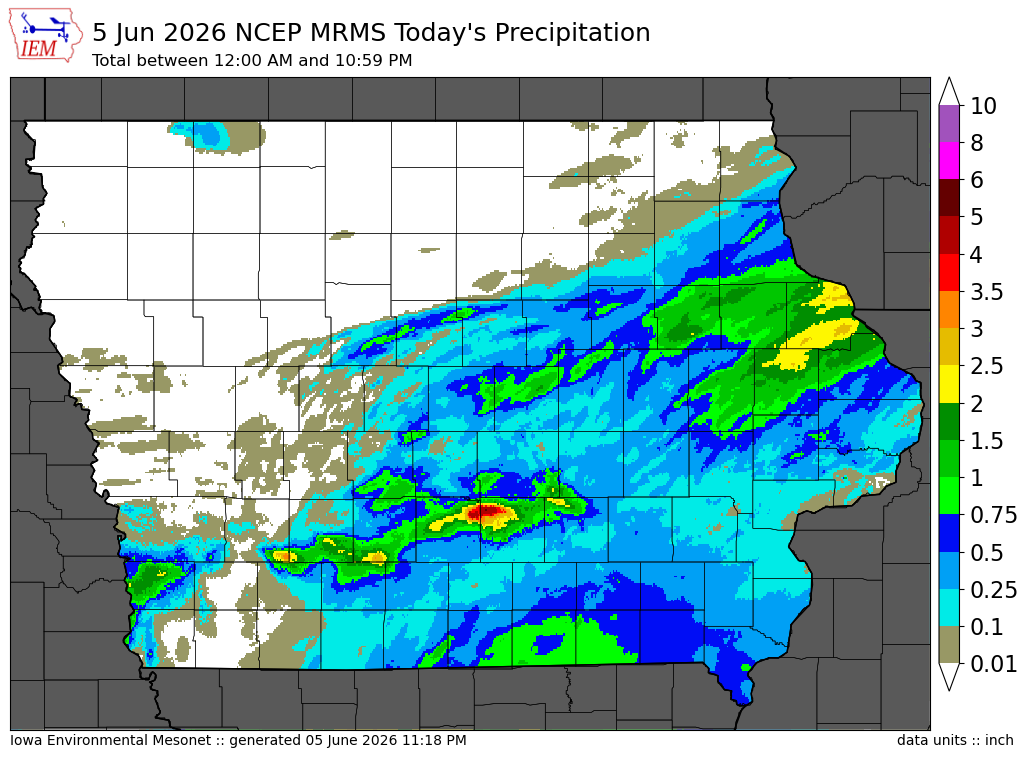
The IEM combines data from participating networks into products like maps shown above and web applications to analyze the data.