The Iowa Environmental Mesonet (IEM) collects environmental data from cooperating members with observing networks. The data are stored and made available on this website.

IEM Daily Feature

July Precip vs Pressure

Posted: 17 Jul 2026 05:30 AM, Views: 635
The high pressure system that has been in firm control of our weather this week loosened its grip slightly on Thursday allowing for some scattered afternoon storms to develop. For July, sea level pressure readings this week have been near the top of the observed range thanks to the strong upper level ridge. The featured chart takes a look at the maximum observed hourly precipitation by sea level pressure for Des Moines during July. A general and intuitive relationship is shown with maximum precipitation values generally decreasing as pressure readings get to either extreme of the observed range. While the reason for the decrease in precipitation for the highest pressure seems obvious as higher pressure implies less upward vertical motion in the atmosphere, why do values decrease at the lowest pressures as well? The speculative reason likely has to with the most intense storms being displaced from the surface low pressure center and perhaps also due to stronger winds associated with lower pressures and leading to faster storm motions with less training of storms over the same location.
Rate Feature

Previous Years' Features
Carroll Position 3, IA Webcam:
News Items  

ISU Network Outage [resolved]
Posted: 12 May 11:06 PM

1 April IEM Outage [resolved]
Posted: 2 Apr 10:55 AM

Tracking TAF Amendments
Posted: 13 Feb 10:28 AM

IEM Archival Update
Posted: 24 Sep 11:07 PM

TAF Archive Fixes
Posted: 22 Aug 7:28 AM

Sign up for the Daily Bulletin

Current Website Performance:
Bandwidth: 53.9 MB/s
Total Website: 3,120 req/s
API/Data Services: 171.4 req/s
API Success: 100%

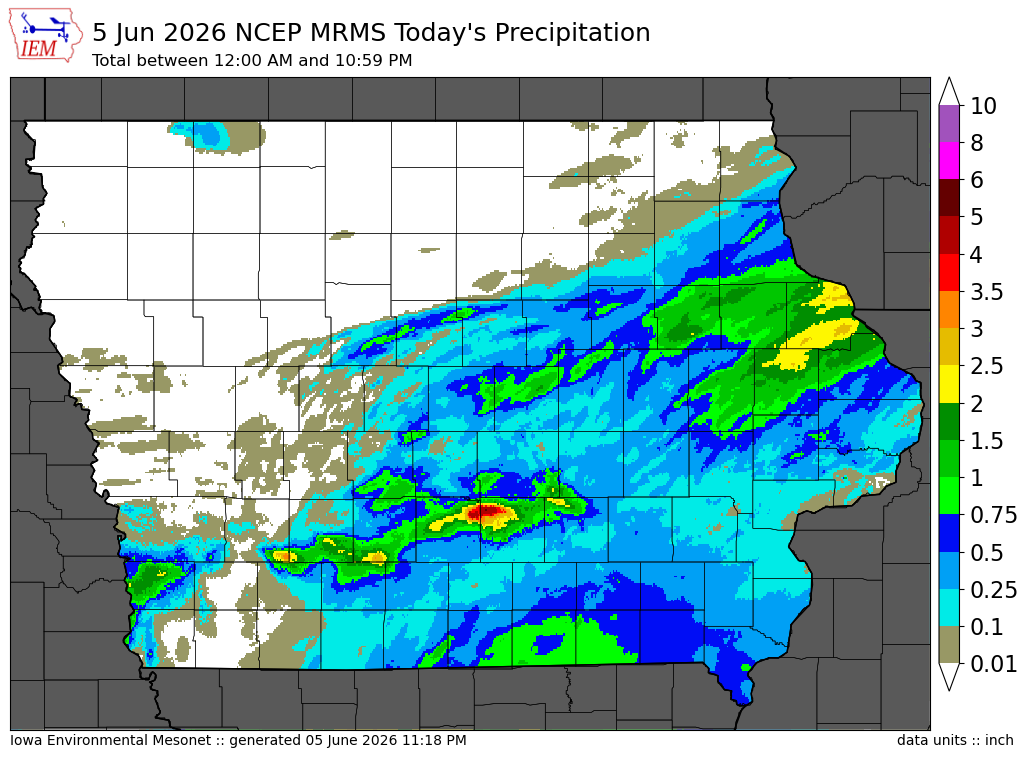
Soil Temperatures

Data from the Iowa State Soil Moisture Network is found on this website and daily soil temperature averages are used to produce the highlighted analysis.
Current Data
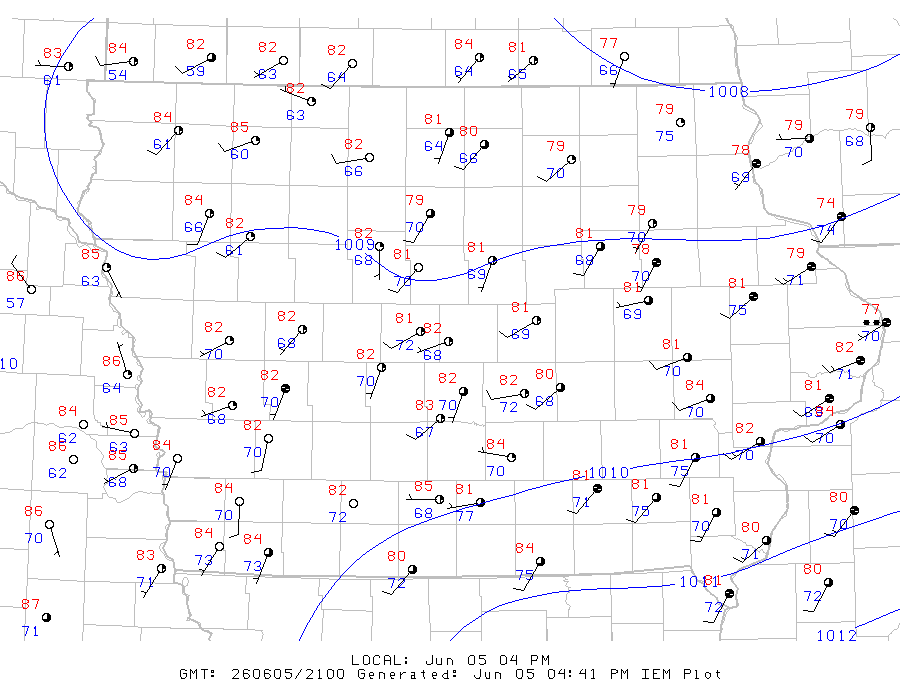
The IEM combines data from participating networks into products like maps shown above and web applications to analyze the data.

More current products »